What do LA and IR Practitioners do?
Overview
While this chapter cannot cover every detail of what Institutional Research (IR) and Learning Analytics (LA) are and details of how to engage in this work, it does provide a brief overview of major ideas practitioners engage with how they work. With every facet of LA/IR, from collection, analysis, prediction, visualisation, and others, there is a veritable rabbit hole of things to learn, so this chapter will simply serve as an introduction to major concepts.
If you’re interested in going down that rabbit hole, a good place to start is The Handbook of Learning Analytics, an open eBook published by the Society of Learning Analytics Research (SoLAR)
Why is this important?
When working with students, gaining insights into what they’re up to and how they work together is something that we can easily do in the classroom. We can see their physical bodies, how they’re interacting and we can walk up to them and see what they’re doing. For students who are working either fully online, in blended/hybrid modalities this is not always as clear, so having a way to look into these processes is where learning analytics comes in. Having an understanding of how LA works, and what LA practitioners do can help us understand how we can better support learning in these, and other environments.
Learning Objectives
- Understand the basics of what LA practitioners do
- Find and Clean Data
- Consider the best way of presenting data in different ways (e.g., Visualize Data, summarize data, etc.)
- Understand how to incorporate LA at a higher institutional level.
Guiding Questions
As you’re reading through these materials, please consider the following questions, and take notes to ensure you understand their answers as you go.
- Now that we know we need some forms of data, how can we work with and present this data to tell a story to those involved in a project?
- What forms of data might exist, and how might they differ in their usefulness?
- If we wanted to implement learning analytics on a broad scale, what would it take?
Key Readings
Gašević, D., Dawson, S. & Siemens, G. Let’s not forget: Learning analytics are about learning. TECHTRENDS TECH TRENDS 59, 64–71 (2015). https://doi.org/10.1007/s11528-014-0822-x
Clow, D. (2013). An overview of learning analytics. Teaching in Higher Education, 18(6), 683-695.
Macfadyen, L. P. (2017). What does a learning analytics practitioner need to know? In Y. Bergner, C. Lang, G. Gray, S. Teasley & J. Stamper (Eds.), Proceedings of the Workshop on Building the Learning Analytics Curriculum (BLAC), Vancouver, Canada, March 13th-14th, 2017.
Big Data
To start engaging in Learning Analytics we require data or data sets. A data set simply refers to a set of information that comprises many pieces of information on many users. For example, a text file that contains names, locations, dates of birth for students along with their posts in an online discussion forum across a class.
One of the terms you may have seen or read about previously is that of ‘Big Data’. Big Data refers to data sets (that come in many forms) that are simply too big to analyse by themselves. If you’ve ever seen a spreadsheet full of information, and there are lots of rows and columns in that spreadsheet, imagine a sheet so big that the application you’re using to view it and work with the information (e.g., Microsoft Excel) simply can’t handle the amount of information. Manyika, et al. (2011) thus define big data as a data set “whose size is beyond the ability of typical database software tools to capture, store, manage, and analyze”, so if you see this term used in any of your readings or research, this is what it refers to.
Now, typically most educators will not actually engage with big data, or if they do use the term, it may refer to a data set that they perceive to be big, but actually doesn’t fit the defintion. When we think of big data in educational settings, this can also refer to the collection and collation of multiple sources of data (e.g., LMS, blog site, email, enrollment, grades, wifi accesses, etc.) into one massive set. Many educational organisations engage in this large scale collection of information and collect and combine these sources of information into something called a data warehouse. More often than not much of this data is never accessed or acted upon, but trends and key indicators of what the institution might want to look at are there if they wish to see them.
Why and What of Learning Analytics
Learning Analytics has emerged over the last 10-15 years as a response to many factors (Ferguson, 2012). The primary of which are:
- The growth of Big Data and its applications
- The increase in online learning and the use of learning technologies
- Growing political and leadership motivation to measure educational performance to ensure the quality of education
Ferguson notes that the key parties to benefit from this effort would include governments, educational institutions, teachers and learners.
As educational institutions have been using learning technologies that afford the opportunities to collect educational data, the exploration of this data and its potential for informing practice has increased with it.
An important thing to know about LA is the motivations behind it. Due to the multiple interpretations of its meaning and its capacity to inform us on a variety of different factors, motivations may change, however from the teaching and learning side of things, most educators will agree that LA has very little to do with assessment and should be conceptually distanced from assessment whenever possible.
To be clear, learning analytics is usually not tied to assessment in ways that learning analytics can actually assess learning. For example, we cannot (and probably should not) link educational data with marks and grades – quantity of discussion posts or word count of discussion posts is usually a terrible indicator of learning, and those numbers do not provide any evidence that learning has occurred.
Some may disagree with perspective, but many LA practitioners, educators and researchers understand that LA is more about gaining actionable insights into learning processes as opposed to using it to assess students. You’ll notice this in the research in learning analytics as well as any tutorials or videos on the subject you may find.
Learning Analytics Practitioners
The first question may be ‘Who is a learning analytics practitioner?’ Well this typically means anyone working within the field of learning analytics. This can be teachers, researchers, data scientists, software developers and other parties. A growing trend in job titles is that of ‘Data Analyst’. As the field grows and division of labour increases, there are many people working on learning analytics projects who aren’t teachers or researchers – they just work with the data. Often, these individuals have a working knowledge of learning theory and instructional practices, or work closely with people who do. This ensures that the analytics work and any visualisations produced are useful for their intended audience, whether it be government, educational leadership, teachers or even students.
In the video below, Tim McKay, a researcher at the University of Michigan in America talks about how we can use educational data to help students learn, but we must always be mindful of what the data that we collect actually means.
Starting with a Question
As mentioned in the previous chapter, when we want to investigate a phenomena or particular even to learn more about, and perhaps gain insights into the underlying processes and factors that govern how it works, this is almost like a research project, so we have to start with a question. One of the issues that comes up with any sort of analytics work is that more often than not, more data is collected than is needed to answer the question we’re posing, and this has a knock on effect where some practitioners end up foregoing the question altogether and just ‘exploring’ the data to see if they can pull out anything interesting. For this reason, we must be respectful of student privacy and ensure that we do approach this in a way that is like research, by basing everything we want to know on a question. This question can come in many forms, based on the needs of our project or the aims of the classes we teach. See some example questions below, starting with more general questions.
- How to students engage with each other online
- How do students work together in a classroom setting?
- How visually appealing are lecture slides?
- How do students use practice tests?
- How long to students spend studying?
This are very general ‘research’ style questions, and from here we can start to think about the data we might need to answer these questions, leading to sub-questions.
- What time of day do my students log in to the learning platform?
- What do my students talk about in discussion forums?
- Where are my students located?
- How long do they take to complete a learning module?
- How many times to they take practice quizzes?
- What parts of an instructional video do students watch multiple times?
- When students are attending an in-class lecture, when do they look at the PowerPoint slides?
- When students are working together in a classroom setting, how often do they move around?
Either type of question is ok to ask, but the important thing is that we’re asking questions that are related to teaching, learning and pedagogy. If we just ask where students are without having any pedagogical intervention meant to support student learning as a result of this question, then we may be overreaching and may be engaging in needless ‘data mining’.
Types of Learning Analytics
The analytics (the collection and analysis of data) that are relevant for teaching and learning can come in many forms, and serve many purposes. May (2011) outlines three type of analytics that can be used to inform teaching and learning practice.
- Descriptive: What is happening? (e.g., student access logs)
- Predictive: What will happen? (e.g., students who don’t log very often may fail, when compared with other students)
- Prescriptive: What should be done about it? (e.g., given prediction models, what can we do as teachers to intervene?)
May outlines that these are not distinct forms of analytics, and that one dataset and its associated analytics may serve more than one purpose. For example, we can look at student logs to see how often students log in, and if our system is telling us that students who don’t log in have the potential to fail at a higher rate, we can then send them an email to encourage their participation or to check in and offer study support.
These types of analytics are largely theoretical constructs – ideas that can help us to think about analytics in different ways.
Types of Data
Individual vs. Aggregate Data
The first thing to think about is how we want to look at data. Think of it has a hierarchy: At the bottom level we have data on individual users and students – what they do, how they do it, and other data on their individual behaviour; Next we can aggregate (collect and anonymise) this data at the class level to see what students are doing as a group; then one more level up we can look at a degree or program; then institution; then city or town; then state or province; then nationally.
With these different levels there is usually a difference in who should have access and how does this data benefit. For individual data, this is usually beneficial for the student and the teacher – and ethically no one else should really have access to the individual records of individual students should they? For class and program/degree level, instructors and students may not need access to this, and as this data is usually available in aggregate, it is anonymous, so educational leadership and educational support staff would benefit from seeing it and acting up on it. The higher levels we go, the higher levels of leadership will have access to and be able to act on this data.
When thinking about the project you want to work on, whether for evaluation or to improve learning, it’s important to think about what ‘level’ of data you’d need.
The types of data we can collect to help answer our question(s) are incredibly varied. Lai & Schildkamp (2013) built upon Ikemoto & Marsh’s (2007) work in categorising educational data.
Input data
- Data on student characteristic such as data on truancy, intake, transfer and school leavers, home language, ethnicity, and socioeconomic status.
- Data on teacher characteristics, such as data on teacher qualifications and length of teaching.
Outcome data
- Data on student achievement such as assessment results, written and oral exams, portfolios, and report cards.
- Data on student well-being such as well-being surveys.
Process data
- Data on instruction and types of assessment such as observations and documents on instruction and learning strategies, instruction time, organization of instruction, classroom management, and organization of assessment.
Context data
- Data on school culture such as survey or focus group results on the opinions of students and teachers on the school’s atmosphere, climate, and discipline.
- Data on the curriculum such as subject descriptions, rosters, year guides, and special programs.
- Data on building and materials such as data on how many times certain roomsand equipment are used and the availability of computers.
Nistor and Hernández-Garcíac (2018) also provide a brief overview of different types of data collected from a few studies, along with how this information is analysed. These included data from discussion forums, logs for website access, word counts from assignments and even eye tracking data.
‘Traditional’ learning analytics has typically been derived from online learning platforms such as an LMS / VLE and other technologies and are only limited to what the platform itself can collect. As learning happens outside of the digital systems, there is another sub-field of Learning analytics called Multimodal Learning Analytics (MMLA). See What are the current trends in Learning Technology? for more on this topic.
Accessing Data
Educational data is everywhere and how we access it can depend on the question we want to answer. Many teachers have access to information on the learning platforms they currently use, so when specific students submitted their assignments as well as the marks / grades they achieved are technically learning analytics data.
Finding Sample Data
- Google dataset search: This is a special Google search that lets you find open data sets that are freely available to download
- Open University UK Learning Analytics dataset: Sample dataset that contains, students and how they interact with the LMS/VLE
- DataShop @ CMU: Data repository by Carnigie Mellon University where you can search for datasets by use case.
- Educational Poly and Data Centre: An organisation based in the US that houses educational data from many countries.
- Australian Research Data Commons Research Data Repository: Provides open data sets on all sorts of research conducted by Australian organisations. You can search for topics of interest (e.g., ‘online forum’)
- Data is Plural is a weekly newsletter of data sets (sometimes including educational sets)
- Here’s a filterable data set of COVID-19 related school enrolment data from America
Cleaning Data
Now that we have some data, we need to look at its raw form and see how useful it is to us. Sometimes information within a dataset is not perfect for working with, so we need to clean it. This means doing a few things to it.
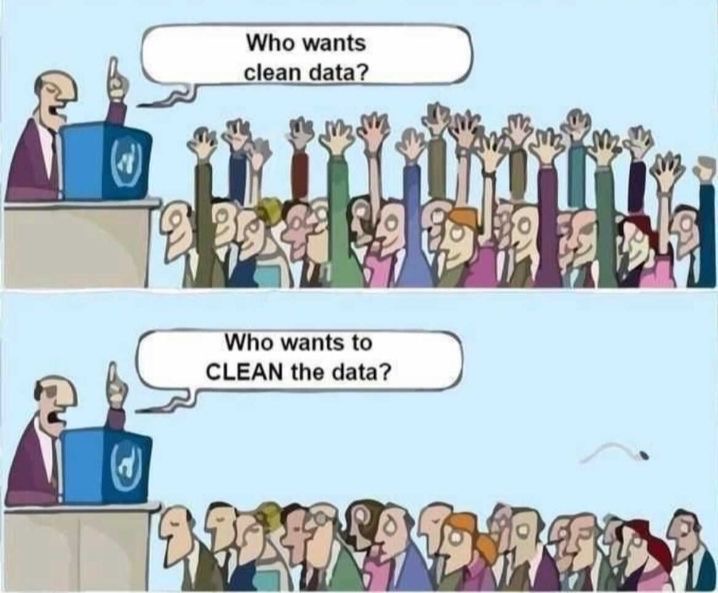
- First we can reduce data by deleting columns that may not really be useful for helping us answer our question.
- Next we can fix data errors that may exist, like spelling or category errors to make sure that the information is reliable (e.g., we don’t want a chart showing separate entries for ‘Bananananas and Bananas’ when it’s the same thing)
- Lastly we can transform data if it’s not in the format we want – this can be a simple format change from a text entry to a number or it can be more complicated, like turning a raw test score into a percentage.
The order in which we clean our data doesn’t really matter – and it’s a really subjective exercise, such that its really all about what we as practitioners want to pull out of the data. If you’re having trouble wrapping your head around this topic, the first few minutes of the video below has a good explanation (the latter parts contain more statistical analysis jargon and practices)
Analysing and Presenting Data
Now there are many ways to present information, with the simplest way being the raw text data that we can pull from our educational data sources. These can be CSVs (Comma Separated Values), JSON files (Javascript Object Notation), or simple spreadsheets in Excel or Google Sheets. Going through these documents though can be tedious and it may be difficult to see trends or patterns.
Data Analysis
This is where analysis comes in. Analysis is just the process of taking all this raw data and finding these patterns and trends. These approaches are very similar to general research data analysis, using statistics to examine data sets. This can come in the basic forms of look at average test scores, seeing the average time students spend on a quiz and looking at trends in this information over time, across different tests and across different quizzes. It can also involve examining the relationship between these factors across students, classes, years, etc.
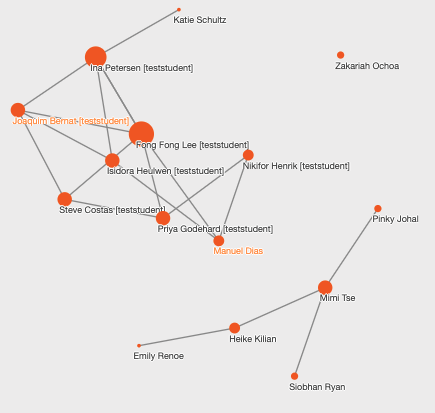
Social Network Analysis (SNA)
One common form of analysis you might see presented as a visualisation (below) is Social Network Analysis (SNA). This type of analysis looks at how students interact with each other using a learning technology like a discussion forum. It can be presented as a table of data or as a visualization, but it collects and looks at trends in the relationships between individual users and the nature of their discourse.
Content and Semantic Analysis
As noted by Clow (2013) other types of analysis relate to the content itself, not just the nature of interactions. This means that data analysts and LA practitioners can provide detailed analysis of the content of online discourse, or even what is produced as part of an assignment. This can involve looking at the length of a discussion post or video, the words used within an activity (sometimes visualised with a word cloud).
Another approach is called Natural Language Processing (NLP) which has links to Artificial Intelligence and Machine Learning. In this area of analysis, the content of online discourse can be analysed by trained AI and ML algorythms to derive meaning from the content of a discussion forum for example (see Robinson et al., 2016). In Robinson’s example, their NLP was able to thematically group the discourse (the words themselves) in a MOOC (Massive Open Online Course) into specific categories that spoke to the students intention and motivation. More advanced models of this analysis can look at the words in discussion forums, or spoken words in videos and derive emotional states, moods and other affective data to inform educators and educational leaders.
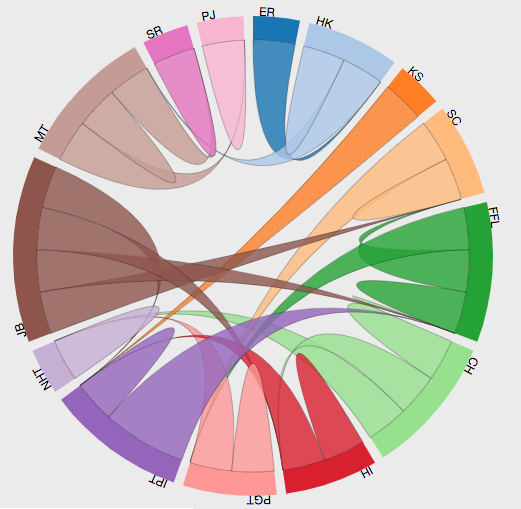
Data Visualisation (DataViz)
If you’re new to Learning Analytics, you may be familiar with simple types of visualisations that you’ve created before for budgeting, or even a math class when you were in school. These visualisations come in the form of bar, and line charts and are plotted along an X, Y axis. Variations of this format can show us lots of information.
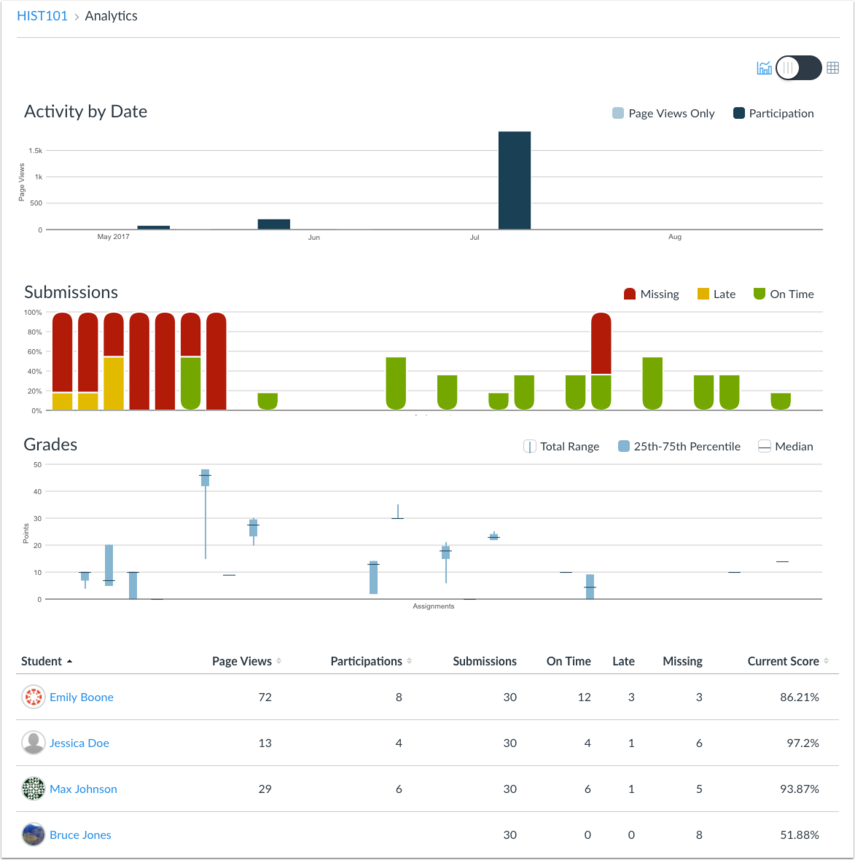
In the example below we can see student participation data, along with easy presentation of student submissions. For those just starting out in exploring Learning Analytics, bar, pie and line charts are the best place to start.
There are however, so many different types of visualisations that can be created using more advanced tools.
Check out this gallery of a programming framework called D3 (Data-driven Documents). This site doesn’t contain any LA visualisations specifically, there are many different types of visualisations that can be used to tell a story about what is happening, and many learning analytics platforms are starting to use tools like this to show easy to understand trends and patterns.
This mini-dashboard uses a simple implementation of D3 to let students see a heat map of discussion participation across 3 different classes. The heat map shows the relative level of engagement per hour for every day of the week. What patterns do you see?
Tableau also has a great sampling of ways to visualise educational data. Note the K-12 and higher education options on the left of this page.
Many times, different charts and different datasets can be combined into something called a ‘Dashboard’, and this allows a single screen to display lots of information to a user, so they can see patterns and trends, filter information and data and even act up on it (e.g., some dashboards or online learning platforms allow quick and easy messaging of students based on their last known login time)
If you’d like to check out some examples of DataViz, check out the list below:
- Reuters Graphics
- The Upshot (New York Times)
- The Pudding
- Flowing Data
- Reddit – Data is Beautiful subreddit
- Kantar Information is Beautiful Awards
- Quartz Data Viz
- Observable
- fivethirtyeight
- Twitter #dataviz
Data visualisations are also becoming an art form of sorts. Check out this visualisation of the lyrics in the musical Hamilton is particularly fun to play with (Shirley Wu)
Implementing Learning Analytics
Learning Analytics being a relatively new area of research and practice, over the years it has been quite challenging to implement on a large scale in different educational organisations. Colvin et al. (2017) discuss various issues that arise when launching a learning analytics initiative at a large scale including technical readiness related to data collection, collation and storage; institutional culture surrounding the need for embedded reflective practices in teaching and learning; support and direction from different levels of leadership; the overarching strategy adopted by the institution and the capacity of staff to engage in this work. The belows video (around an hour long each) provide an overview of how Utah State University (left) has embedded LA practices into their institution as well as institutional issues and approaches to LA (right). These are interesting, but not required reading.
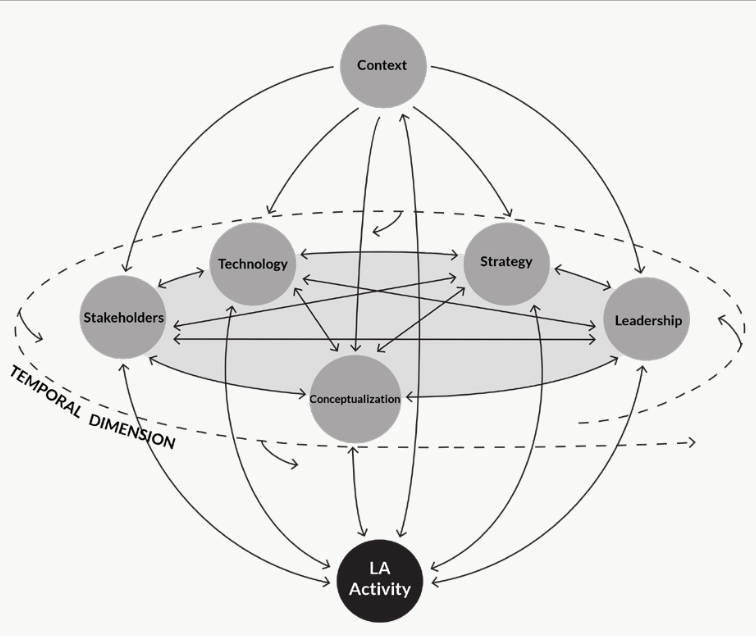
Model of Strategic Capability (Colvin et al., 2015, p. 28).
Institutional Leaders in this area includ:
- University of Michigan (USA), which has an ongoing project on Student-facing Learning Analytics.
- University of South Australia (Australia)
- University of British Columbia (Canada)
Key Take-Aways
- Learning Analytics is a broad and growing area of educational research and practice, with the aim of improving teaching and learning.
- Where we get our data, how we use our data and how we show are data are all parts of what LA practitioners do
- Visualisation of data makes it easier (and potentially more confusing) to understand how to act upon the data to improve learning
- There are some challenges in the implementation of LA at broader levels
Revisit Guiding Questions
Have a think about the types of data that might be relevant to you and your work and consider how you might source and work with that data to provide actionable information for others who may be less familiar with everything you read in this chapter. What would they need to know? How would you go about sharing it?
References
Colvin, C., Dawson, S., Wade, A., & Gašević, D. (2017). Addressing the challenges of institutional adoption. Handbook of learning analytics, 1, 281-289.
Colvin, C., Rogers, T., Wade, A., Dawson, S., Gašević, D., Buckingham-Shum, S., Fisher, J. (2015). Student retention and learning analytics: A snapshot of Australian practices and a framework for advancement. Can- berra, ACT: Australian Government Office for Learning and Teaching.
Lai, M. K., & Schildkamp, K. (2013). Data-based decision making: An overview. Data-based decision making in education, 9-21.
Ferguson, R. (2012). Learning analytics: drivers, developments and challenges . International Journal of Technology Enhanced Learning (IJTEL), 4(5/6), 304–17.
Manyika, J., Chui, M., Brown, B., Bughin, J., Dobbs, R., Roxburgh, C., & Hung Byers, A. (2011). Big data: The next frontier for innovation, competition, and productivity. McKinsey Global Institute.
May, T. A. (2011). Analytics, University 3.0, and the future of information technology.
EDUCAUSE Review Online. Retrieved from https://er.educause.edu/articles/2011/9/analytics-university-30-and-the-future-of-information-technology
Nistor, N., & Hernández-Garcíac, Á. (2018). What types of data are used in learning analytics? An overview of six cases. Computers in Human Behavior, 89, 335-338.
Robinson, C., Yeomans, M., Reich, J., Hulleman, C., & Gehlbach, H. (2016, April). Forecasting student achievement in MOOCs with natural language processing. In Proceedings of the sixth international conference on learning analytics & knowledge (pp. 383-387).
Further Reading
Big data: The next frontier for innovation, competition, and productivity
Understanding Clean Data (part of Google Data Analytics Certificate)
Architecting for Learning Analytics: Innovating for Sustainable Impact by Simon Buckingham Shum (UTS) and Tim McKay (UofM)
Guide To Data Cleaning: Definition, Benefits, Components, And How To Clean Your Data (Tableau)
The Data Analytics and Learning MOOC on Youtube has some great content too!
Colver, M. (2018). The lifecycle of sustainable analytics: From data collection to change management . Office of Student Analytics: Utah State University.
Did this chapter help you learn?
100% of 3 voters found this helpful.
Provide Feedback on this Chapter